Moving over to a new blog engine (Hugo) is not a simple task. I had to extract out my approximately 1000 blog posts from WordPress as Markdown, fix up all their metadata, and then start fixing all of the HTML that was mangled into a weird mix of markdown and HTML. The overall goal seemed worth all of this work:
- Clean HTML
- High performance
- Low cost site
Once I had it up and running, I decided to evaluate the performance compared to the old site and then spend some time trying to make it as fast as I could.
My performance testing process #
Whenever I’m looking at performance tuning, I follow a fairly simple pattern. I measure to figure out what’s slow and then I try to make that specific thing faster and/or try to do it less. Repeat as necessary.
As a starting point, I decided to get rid of a bunch of unnecessary things by going with a static site. That means, in a standard “user goes to page” scenario, no server code runs and no database needs to be accessed. That alone should make a huge difference due to two key factors. First, the actual time that it takes for a single page to be generated, returned to the browser and rendered. The second benefit is the reduction in the overall amount of work happening on our server.
Reducing the page load time is good for the user. Reducing the amount of work done on the server is good for our budget and scalability.
My goal was to try to make this new version as fast as possible, while working in a very methodical way. I wanted to know that I’m making things better, so I started by comparing the existing site (WordPress) to my newly published static site (generated HTML, hosted in an Azure Static website, behind the Azure CDN) before I made any changes.
For all of my tests, I was using this single blog post, and the same settings in WebPageTest. Pick the location and connection speed that works for you, but make sure you are using the same settings for every test. I always selected ‘First View and Repeat View’ so I could see what a ‘cold’ request looks like vs. one with some items in the cache.
First test (baseline vs. WordPress) #
First comparison matched up with expectations. The static version of a given blog page was faster and more lightweight.
WordPress (Source on WebPageTest.org)
| Run | Load Time | First Byte | Start Render | Requests | Bytes In |
|---|---|---|---|---|---|
| First View | 3.965s | 1.150s | 2.900s | 59 | 870 KB |
| Repeat View | 2.441s | 1.170s | 1.900s | 6 | 66 KB |
Baseline of New Blog (Source on WebPageTest.org)
| Run | Load Time | First Byte | Start Render | Requests | Bytes In |
|---|---|---|---|---|---|
| First View | 1.862s | 0.306s | 0.900s | 10 | 704 KB |
| Repeat View | 0.515s | N/A | 0.400s | 0.409s | 0 |
Better in every respect, as it should be. It is doing way less on the back end and the front end.
Quick disclaimer: I’m quite happy to lose some functionality in return for the simplicity and performance improvements, but that may not work for you. Biggest loss, in terms of features, would be the lack of a commenting option. Adding that to my static site is definitely possible, likely using a 3rd party service, but for now I’m going to skip it.
At this point, I was actually a bit disappointed though. Yes it was way faster, but it seemed to me that it should be much better than this. The page (from a user’s point of view) is essentially doing nothing and, with the CDN in place, the server isn’t really involved, so why was I seeing close to 2s on a good connection?
Looking at the waterfall view from WebPageTest was a good place to start.
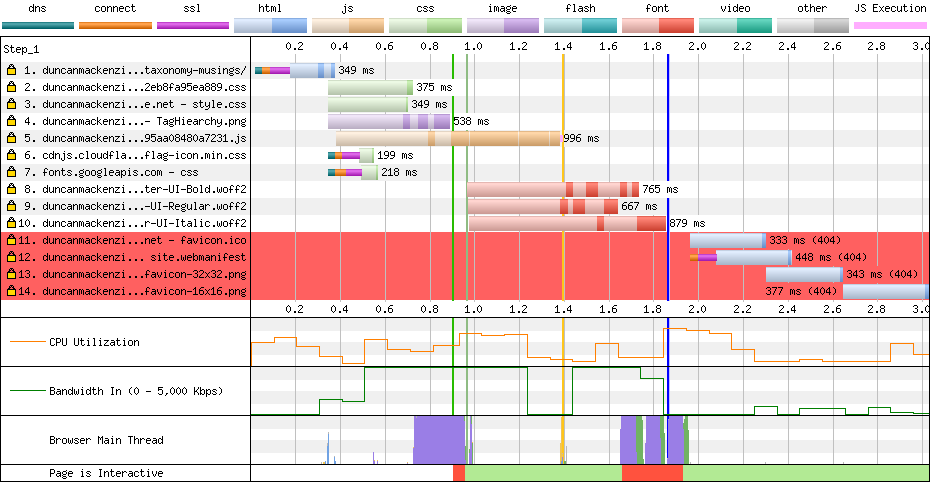
Ignore all the red lines at the bottom, I hadn’t created a favicon or web manifest at this point, but the theme still had links to all of those in the metadata. The real part that jumped out to me was the loading of a set of custom font files (lines 8, 9 and 10). Not only are they large, but being fonts that the page needs, they have a real impact on the time until the page can be rendered for the user. Given that they are part of my site, instead of a Google font for example, they also won’t be in anyone’s cache, so this impact will be present even in real-world usage.
Optimization one, getting rid of the local fonts #
I considered dropping all of the web fonts, but I decided to just switch to a Google font, since I was already loading one for source code listings.
<link href="https://fonts.googleapis.com/css?family=Roboto|Source+Code+Pro"
 rel="stylesheet">
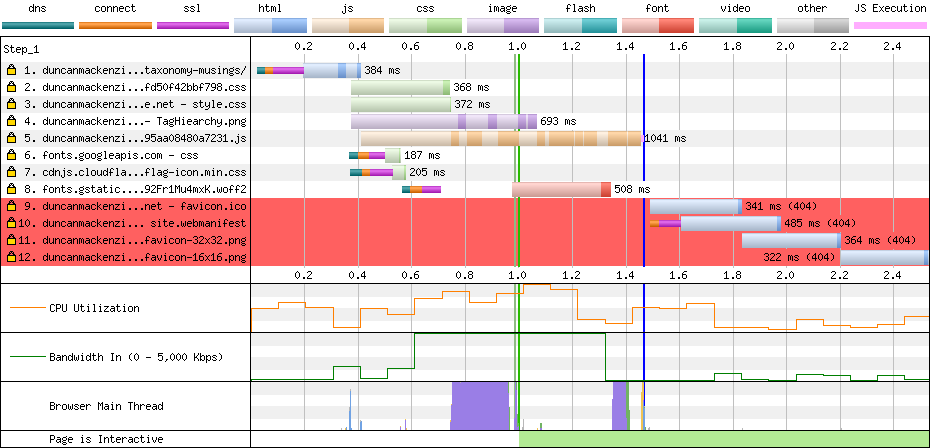
At the same time, I had noticed that the CSS returned by the googleapis.com call in turn referenced fonts.gstatic.com to load the actual font file. This resulted in a small performance hit as it had to do the DNS lookup, connection and TLS/SSL negotiation later on (after it had processed the css). I added a preconnect link tag to allow that to happen a bit earlier in the timeline, as you can see on line 8 of the new waterfall.
<link rel="preconnect" href="https://fonts.gstatic.com/" crossorigin>
Preconnect is just one of the browser hints you can use, for more info check out this great overview of how Resource Hints work and ideas on when to use them.
It made for a good improvement, knocking the median first view load time to 1.466s (from 1.862s) and the bytes sent down to 446 KB (from 704 KB).
After removing local fonts (Source on WebPageTest.org)
| Run | Load Time | First Byte | Start Render | Requests | Bytes In |
|---|---|---|---|---|---|
| First View | 1.466s | 0.330s | 1.000s | 8 | 446 KB |
| Repeat View | 0.333s | N/A | 0.300s | 0.332s | 0 |
The next ‘problem’, JavaScript #
Performance optimization is a process of continually finding the next problem to address, and in my case (going back to the handy waterfall diagram from above) the JavaScript (line 5) is the issue.
My first thought was that this made no sense. As far as I could tell, looking at my site with its nice simple theme, JavaScript was only needed for the little hamburger menu and the dark/light theme switcher. I’m no JavaScript expert, but that should not be adding 300 KB of JavaScript to my page. Those 300 KB are more negatively impactful than a similar sized image as well, as JavaScript needs to be parsed and executed. If you’re curious, Addy Osmani has a great article on the impact of JavaScript.
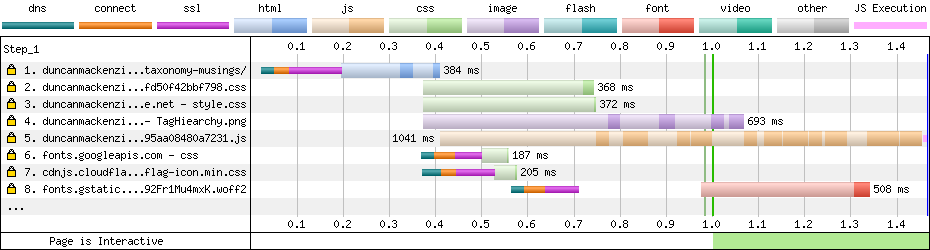
Digging into the theme, I realized the script also included Prism.js, to syntax highlight any code listings on the page. Not every one of my pages has source code, so I started thinking of having two JS bundles, and only bringing Prism in when needed, but I discovered that Hugo is capable of doing syntax highlighting as part of the page generation process. Switching to that, I was able to drop Prism out of the JavaScript bundle (some css changes were needed as well to bring in Hugo’s Chroma styles and remove the Prism ones), reducing it down to 0.5 KB.
Ideally I’d have made only one change at a time, but I also fixed up the missing favicon/webmanifest items, because those red lines were bugging me. You can see the new JavaScript load at line 5.
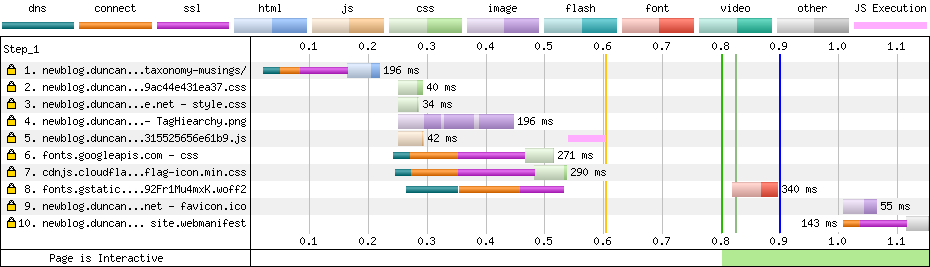
At this point, I was starting to feel pretty good about the performance numbers, which were below 1s on page load. This was from the default location of Dulles, VA over a high-speed connection, but these improvements would help slower devices and slower connections as well.
After reducing the JavaScript (Source on WebPageTest.org)
| Run | Load Time | First Byte | Start Render | Requests | Bytes In |
|---|---|---|---|---|---|
| First View | 0.900s | 0.213s | 0.800s | 0.849s | 8 |
| Repeat View | 0.334s | N/A | 0.400s | 0.410s | 0 |
Adding analytics #
My goal was for my site to do the least amount of work, load the lowest number of resources, and run the smallest amount of JavaScript, but I couldn’t get rid of everything. Once I had the site performance up to what seemed acceptable, I realized I would need to add something to the site to be able to get basic analytics.
I decided that Google Analytics would be the ideal way to add stats tracking, as it is feature rich and I wouldn’t need to build any of my own reports.
Starting with the async-enabled version of the tracking script, I tried adding it to my site in three different ways:
- Putting it into the footer of the site
- Adding a preconnect link for the domain it calls
- Moving it to the
<HEAD>
The difference between these three was very small (different amounts on different runs, which isn’t unusual), but a few minutes of testing wasn’t that hard and I really didn’t want to undo all my earlier performance work. In the end, the first attempt (async script in the footer) seemed to produce the best result.
After adding Google Analytics (Source on WebPageTest.org)
| Run | Load Time | First Byte | Start Render | Requests | Bytes In |
|---|---|---|---|---|---|
| First View | 0.992s | 0.210s | 0.800s | 9 | 136 KB |
| Repeat View | 0.694s | 0.691s | 0.400s | 1 | 0 KB |
It’s slower than without analytics, especially on the repeat view (because the analytics code creates traffic on every view), but for now I’m going to accept this.
Conclusion #
Web performance is always about trade-offs. If speed was the only concern for my site, I would drop the analytics and switch to system fonts only. Still, even with the appearance I want, and the business-driven goal of stats, I’m still running a site that is roughly 4 times faster than it was before I started.
If you are just starting to think about your own site(s) or planning a new one, I would follow this pattern:
- Generate everything you can in advance
- Host it statically
- Add only essential JavaScript
- Put it behind a CDN